Conrail had these things called “ZTS Maps” that have proven to be wonderful resources for researchers and modelers. Many Conrail fans are already familiar with them, but I wanted to put together a quick explanation of what they were, how they worked, and how to read them.
The first topic to talk about is where to get the maps. There are a number of places you can find them, from train shows, The CRHS’s collection, and most conveniently, the wonderful Multimodal Ways website. The paper maps themselves were half sheets of paper, typically bound in a binder (although they are often found loose). Conrail made specific binders for them, which are quite nice.
The maps have an explanation page explaining the ZTS (zone track spot) system and how tracks are numbered.
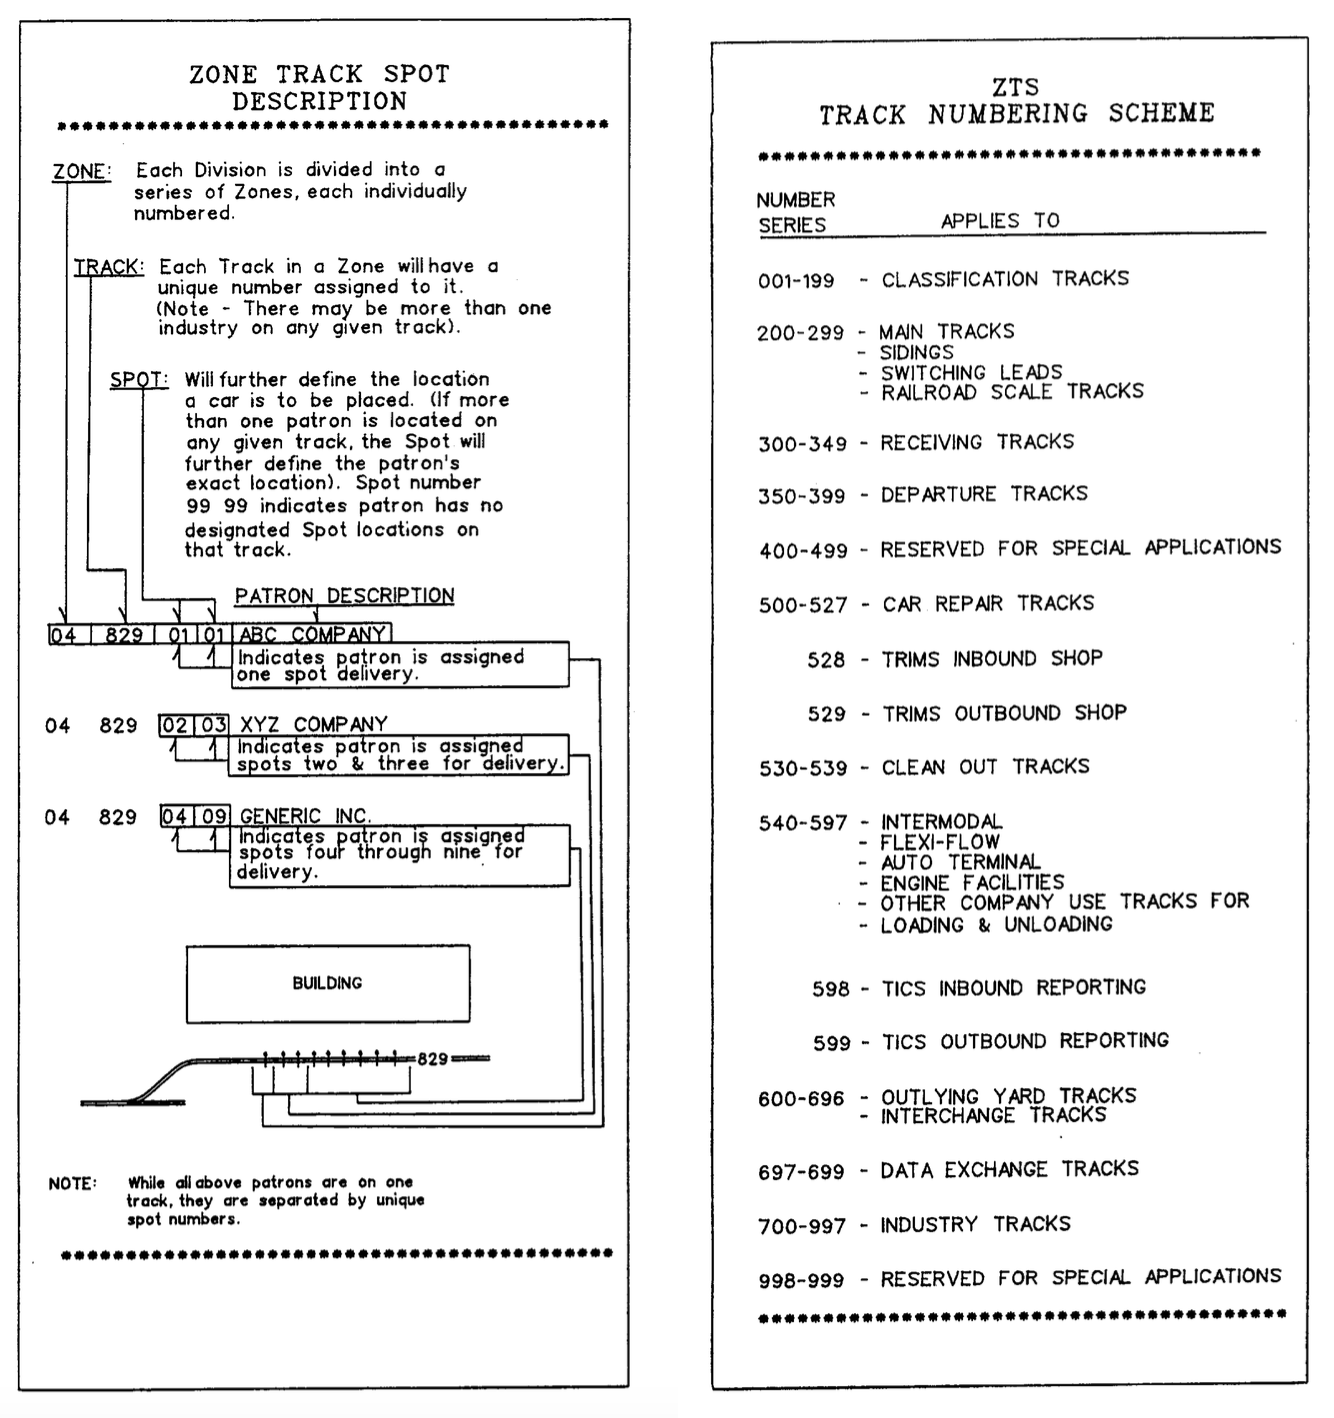
There is also an explanation of what the various symbols that appear on the maps mean.

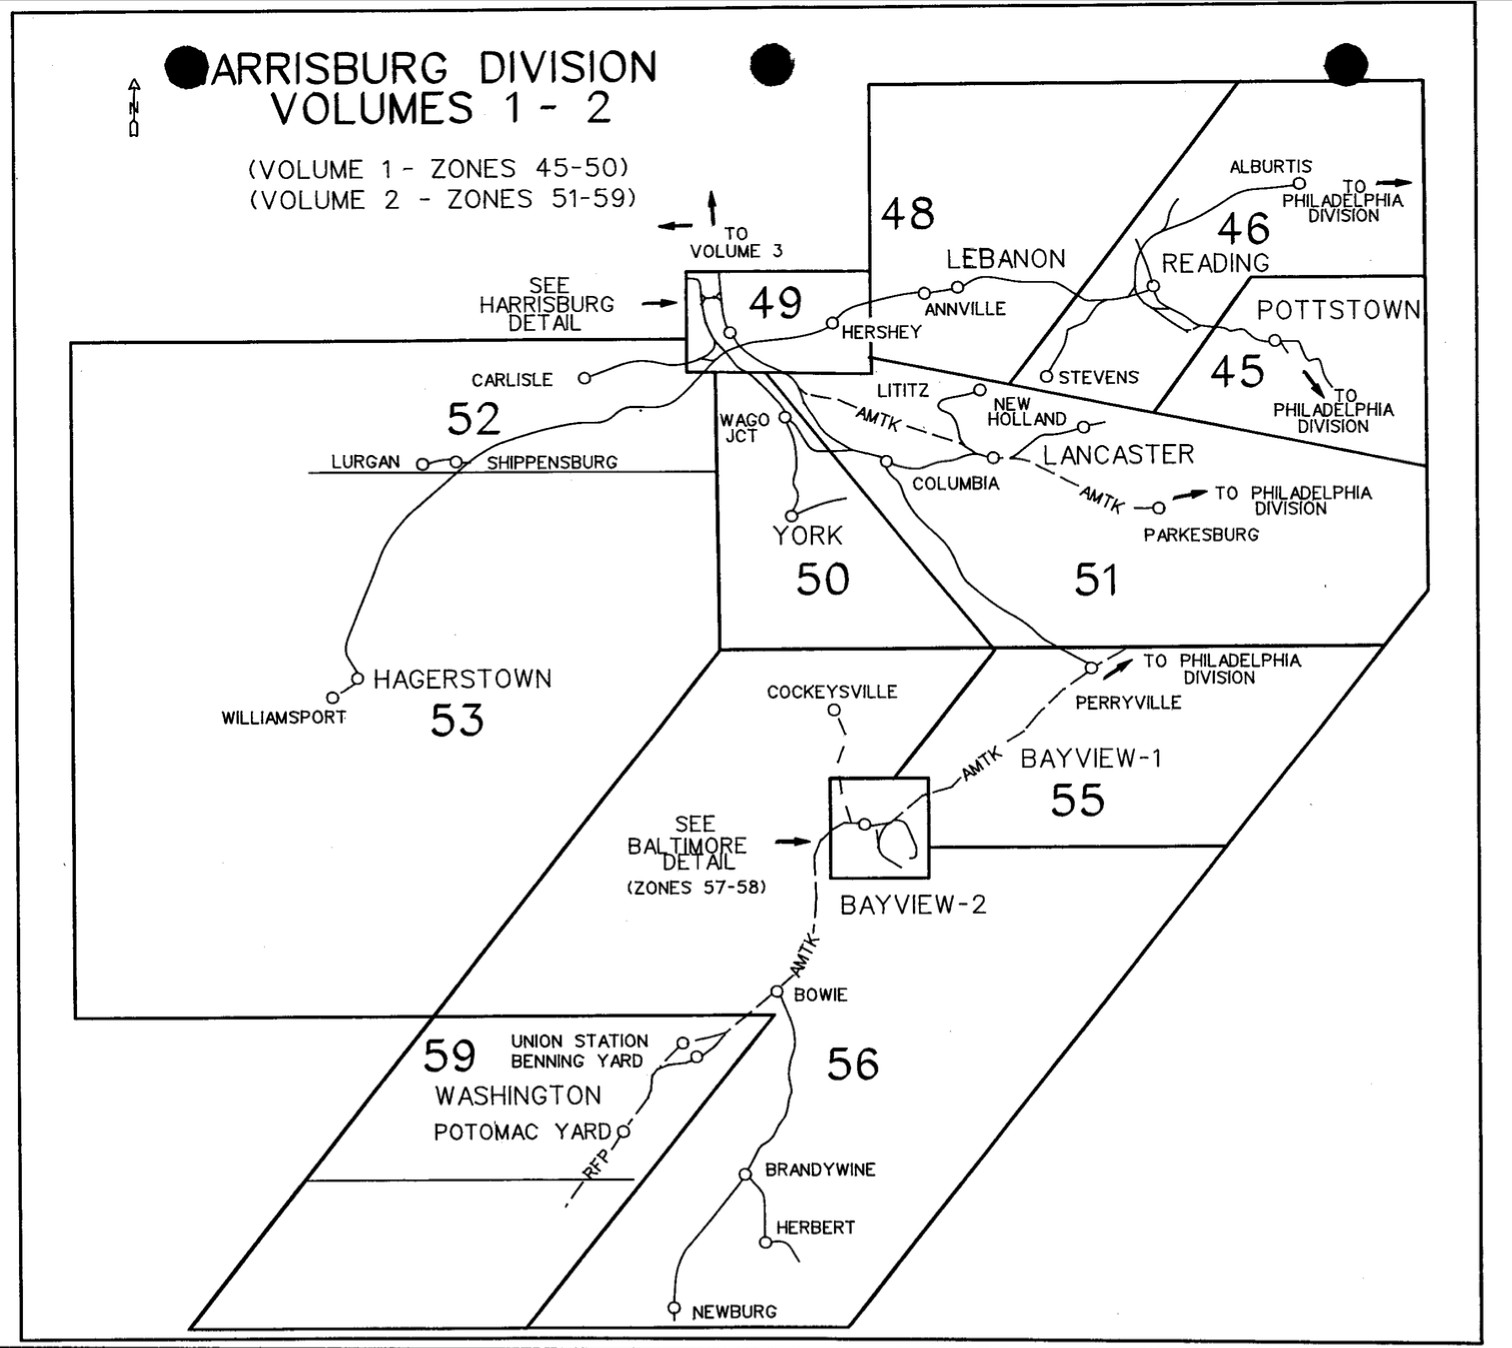
The generally have one or more “table of contents” type pages that explain which zones correspond to which geographic locations. This allows you to figure out where you need to be looking for a location. Additionally, many divisions are split between volumes (each one being too large for a single binder), so you’ll want to make sure you’ve got the volume that corresponds to the location you’re looking for. In my case, since I model York PA, I’m looking for the Harrisburg Division Volume 1 (which these examples are from).
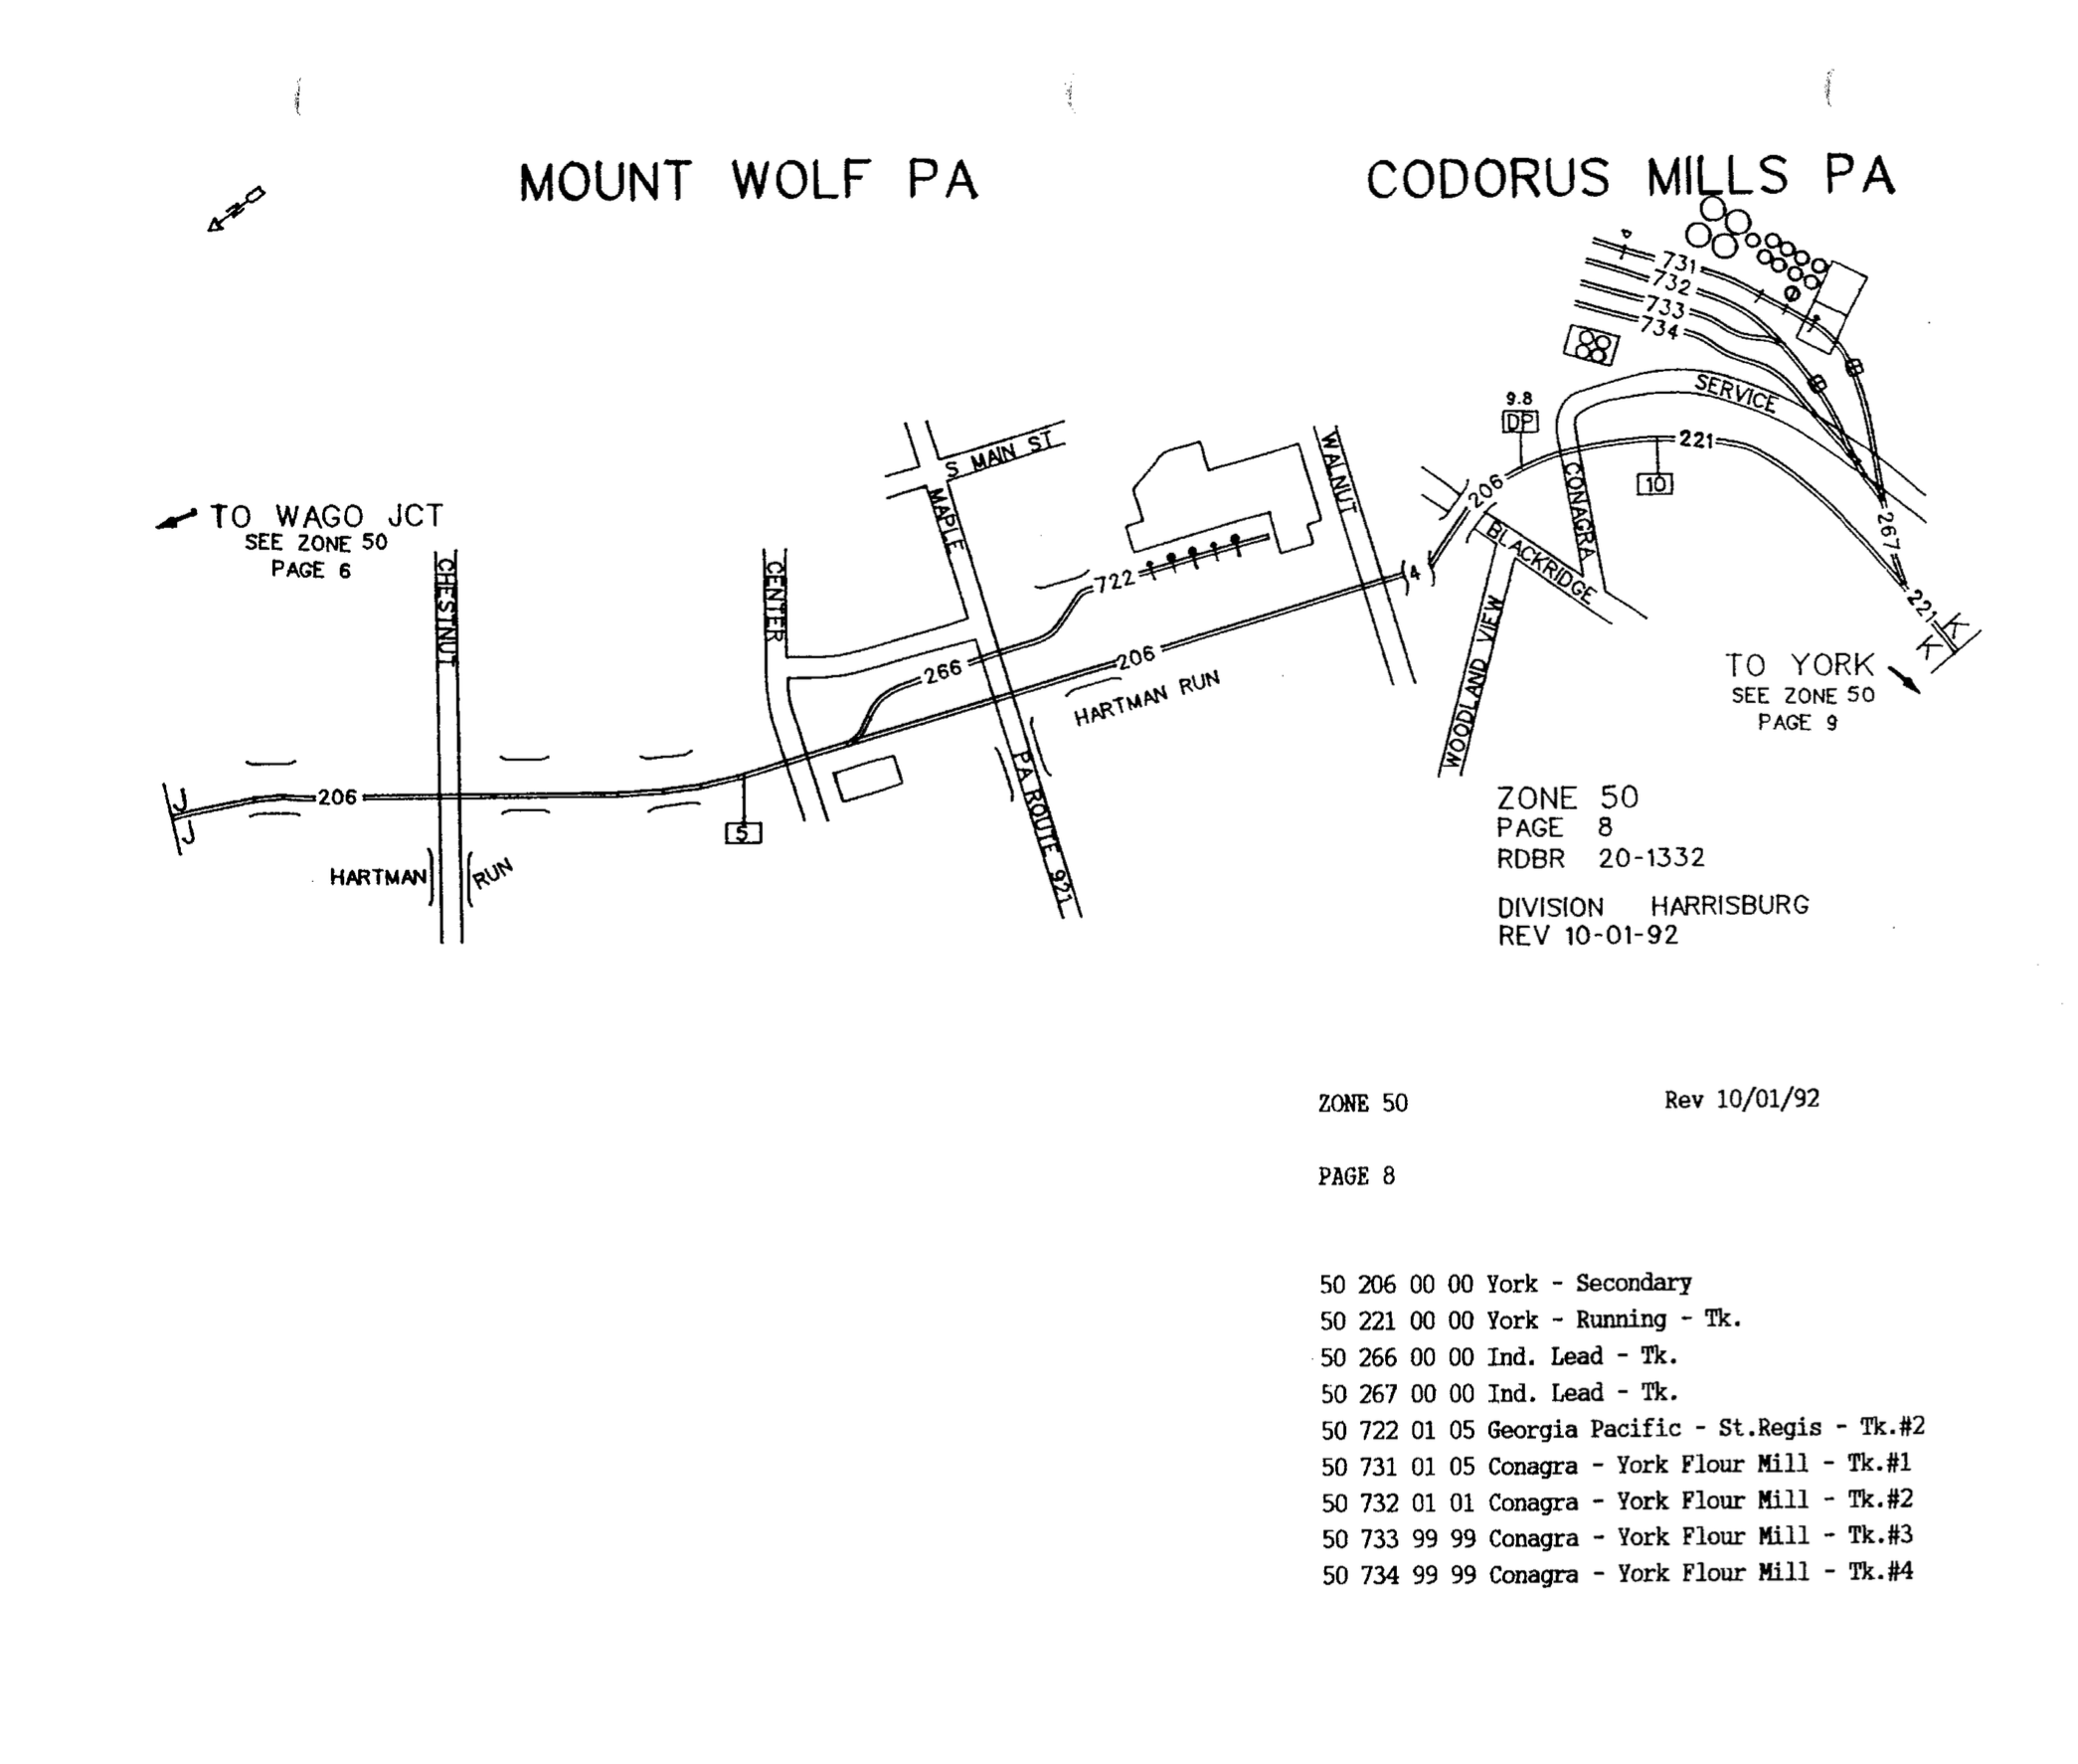
Lastly, there are the maps and legends themselves. The map pages show the name of the town the tracks represent and the map itself, with all tracks numbered and geographical features labeled. The legend page (usually facing the map in the book, but combined in the graphic below) explains which tracks are what, and what customer is on the track. The example below shows both Mount Wolf PA and Codorus Mills (just north of York). You can see, by comparing the aerial photos to the maps just how accurate they are. I chose these locations because they have remained largely unchanged in the 25 years since these maps were released. Interesting to note, however, is that there are two “new” industries that had opened and received rail service between these points that, because they were absent in this 1991 map, we can tell have started receiving rail service between then and now.
 With all this awesome info on them, you’d think these were created by and for the benefit of the transportation guys (you know, those who actually had to go to these places), but the story is actually quite different. They were born of a marketing effort. The maps originated from the need of salespeople who may not have been familiar with the railroad’s territory to be able to tell what facilities and services were available to different customers.